
| Help & Instructions for BufferCapacity3 |

|
Help and instructions for BufferCapacity3
BufferCapacity3 was developed by USDA Agricultural Research Service scientists at the USDA/ARS laboratory in Raleigh, NC (Food Science Market Quality and Handling Research Unit).
The BufferCapacity3 program processes titrator data to generate buffer models of aqueous food ingredients. Methods for buffer modeling for food ingredients have recently been published (Price et al., 2020; Longtin et al., 2020). The BufferCapacity3 program is currently configured for processing text file output from Hanna Instruments HI900 and HI930 series titrators. An example titration file showing the file format is in Appendix 1. Titrator data files are processed by the readRPT.m algorithm. A matrix consisting of rows with the volume of acid or base (in mL) added at each step of a titration and the resulting pH value is generated. Matrices for acid and base titrations of a food ingredient are then combined and converted into buffer capacity (BC) values, typically over the pH range of pH 2 to 12. It is possible to modify the Matlab readRPT.m algorithm file to accommodate other titrator text output files. A model is then generated from the BC data using a two-step curve fitting algorithm (Price et al., 2020). The output of the program includes a matrix of monoprotic buffers that defines the buffering influencing pH for the food ingredient that was titrated. Output from the program consists of a database file containing the raw data, the buffer model data, parameters used for processing, and other data. Several other files are produced, as described in Appendix 2 of this document.
The file ‘Help and Instructions for BufferCapacity3.pdf’ contains the instructions printed here and is also available for free download.
Installation:
A link for downloading the software and the help file can be found here.
The current software available as a Matlab application or MS Windows executable file which does not require Matlab. For the Matlab version, the Matlab Optimization Toolbox is also required. After downloading the file BufferCapacity3.mlappinstall, simply drag the file into the Matlab command window. The program will install automatically and can be launched from the Matlab Apps tab at the top of the main window. For the MS Windows version, download and run the install program.
References:
Price RE, Longtin M, Conley Payton S, Osborne JA, Johanningsmeier SD, Bitzer D, Breidt F. 2020. Modeling buffer capacity and pH in acid and acidified foods. J Food Sci 85(4):918-925. https://doi.org/10.1111/1750-3841.15091
Longtin M, Price RE, Mishra R, Breidt F. 2020. Modeling the buffer capacity of ingredients in salad dressing products. J Food Sci 85(4):910-917. https://doi.org/10.1111/1750-3841.15018
Steps for processing titrator data files and generating buffer model data:
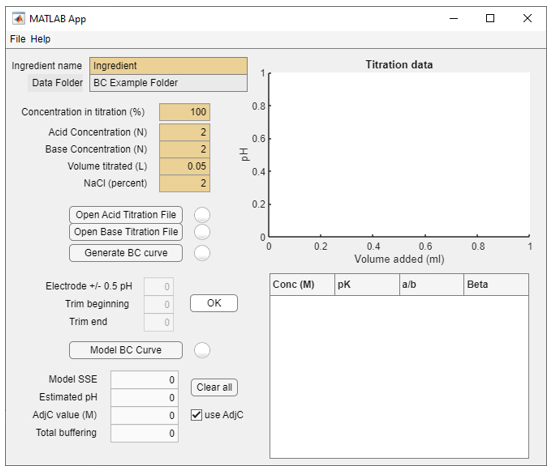
1) The initial program screen highlights (gold color) the information that should be entered (see Figure 1, below). Item for user input include:
File version 07062022
a. Enter a name for the ingredient to be titrated. It is helpful to use a name with no spaces or characters other than an underscore, as this name will be suggested for use for the program output filenames.
b. Enter a concentration in percent (0 to 100%, for g/100 mL) for the sample being titrated. If the sample consists of a mixture of ingredients, consider using 100% as a concentration representing the mixture.
c. Enter the normality of HCl and NaOH (acid and base) used for the titration. These values should be precisely determined by standardization using end-point titration methods.
d. Enter the initial volume of the solution to be titrated. Typically, 50 mL is used. This should be accurately measured.
e. Enter the NaCl percentage for the solution being titrated. Many acid or acidified foods use 2% NaCl. If other known salts are added the equivalent NaCl concentration can be determined from ionic strength calculations.
Figure 1: The opening screen with gold highlighted entries (default values) for user input.
2) Select Open Acid Titration File and open the appropriate titrator file for the HCl titration. These files may be opened from the menu item, or the buttons as shown in Figure 2. After opening the acid titrations file, select Open Base Titration File, and open the appropriate titrator file for the NaOH titration
Figure 2. Graphs of the acid (red circles) and base (blue circles) titrations should appear in the graph window:

With a successful operation from each button, a green lamp will light
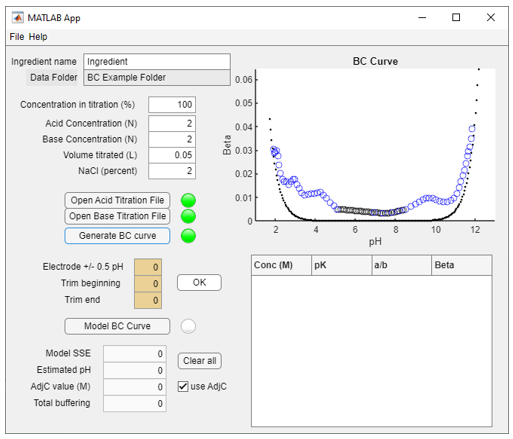
3) Select Generate BC curve, A graph of the buffer capacity data with blue circles (datapoints) and black circles (fills) will appear (Figure 3). The dotted line represents the buffer capacity of water, which is shown for reference:
Figure 3: BC curve, with fill for data gaps (black circles)
4) The curve may be trimmed if needed. It is important to have roughly equal BC values for the ends of the BC curve to accurately determine the total system buffering. The Trim Beginning or Trim End boxes allow the user to enter the number of points as needed to remove one or the other ends of the curve (Figure 4). Push the OK button when finished. In the example, two data points are removed from the end of the curve:
Figure 4: Edited BC curve
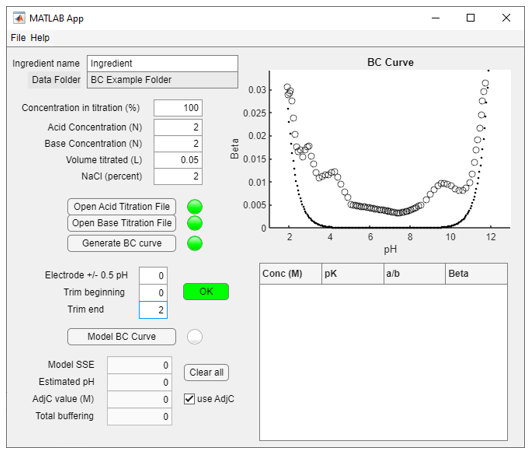
Note that Electrode adjustments (plus or minus 0.5 pH units) can be done if the datapoints lie outside of the water curve for low or high pH values. These adjustments are not recommended but can be used if there has been an obvious pH electrode calibration error. If data lies outside the water curve, it is best to recalibrate the titrator electrode and re-do the titration.
5) Click on Model BC Curve, a buffer model will be generated (Figure 5). As part of this process pop-up graph will appear (as shown below) with the minimization algorithm function data. The buffer model is shown as the solid line and the shaded area under the curve represents the ‘total buffering’. The vertical lines each represent the individual buffers as represented in the buffer table.
Figure 5. Graph of the buffer model and a table with data for monoprotic buffers that define the pH of the ingredient. A graph of the optimization algorithm output is also shown.

Note that the optimization function output graph may be closed at any time. Because the optimization is a search algorithm, closing the optimization graph window while it is still running will stop the optimization.
6) Data from the program can now be saved by selecting the menu item “Save Data Files”, producing the output described in Appendix 2.
Results:
The database file and output information may be useful for determining the total buffering of a food ingredient for comparison with other food ingredients. Total buffering is defined as the area under the curve for the buffer model and is determined by integration of a trigonometric regression model of the BC data (not shown). The value for the definite integral is shown in the Total buffering box at the bottom left of the program screen and is represented graphically as the shaded area under the BC model curve (Figure 5).
Author information:
Fred Breidt, PhD
USDA/ARS Microbiologist
322 Schaub Hall, Box 7624
NC State University
Raleigh, NC 27695-7624
Email: fred.breidt@usda.gov
Web: https://www.ars.usda.gov/southeast-area/raleigh-nc/food-science-research/
Appendix 1: Example of a titrator data file (TI_00010.RPT). This file is an acid titration file. These files have a .RPT extension and are in a DOS text format.
HI902 - Titration Report
Method Name: 1.8 pH Test
Time & Date: 14:25 Apr 11, 2022
Titration ID: Ti_00010
Calibration Data
Buffer Potential Efficiency Temp.
Time and Date
1.679pH 312.0mV 95.6% A 20.0§C
13:51 Apr 11, 2022
4.010pH 181.5mV 99.5% A 18.2§C
13:49 Apr 11, 2022
7.010pH 7.4mV 90.9% A 18.5§C
13:48 Apr 11, 2022
10.010pH -152.8mV 104.2% A 19.2§C
13:50 Apr 11, 2022
12.450pH -309.6mV 104.2% A 18.2§C
13:52 Apr 11, 2022
GLP & Meter Information
Sample Name:
Company Name:
Operator Name:
Method Parameters
Name: 1.8 pH Test
Method Revision: 1.0
Titration Type: Standard Titration
Stirrer Configuration: Stirrer 1
Pump Configuration:
Titrant pump: Pump 2
Dosing Type: Dynamic
Min Vol: 0.015 mL
Max Vol: 0.045 mL
delta E: 12.000 mV
End Point Mode: Fixed 1.800 pH
Pre-Titration Volume: 0.000 mL
Pre-Titration Stir Time: 30 Sec
Measurement Mode: Timed Increment
Time interval: 30 Sec
Electrode Type: pH
Blank Option: No Blank
Calculations: No Formula (mL only)
Titrant Name: 3.0N HCL
Maximum Titrant Volume: 50.000 mL
Stirring Speed: 800 RPM
Potential Range: -2000.0 to 2000.0 mV
Volume/Flow Rate: 25 mL / 50.0 mL/min
Signal Averaging: 3 Readings
Significant Figures: XXX
Linked To: No Link
Final unit is mL.
mL = V * 1000
V = volume dispensed in liters.
Nr Volume[mL] mV pH Graphic Temp.[C] Time
0 0.000 139.9 4.745 0.0 A 20.4 00:00:00
1 0.045 183.6 3.989 4.0 A 20.4 00:01:30
2 0.090 216.9 3.389 3.4 A 20.4 00:02:00
3 0.105 222.4 3.291 3.3 A 20.3 00:02:30
4 0.132 235.1 3.063 3.1 A 20.3 00:03:01
5 0.158 244.1 2.900 2.9 A 20.3 00:03:32
6 0.194 252.5 2.749 2.7 A 20.3 00:04:03
7 0.239 260.2 2.610 2.6 A 20.3 00:04:34
8 0.284 266.4 2.500 2.5 A 20.2 00:05:04
9 0.329 271.0 2.415 2.4 A 20.2 00:05:35
10 0.374 275.1 2.343 2.3 A 20.2 00:06:05
11 0.419 278.7 2.278 2.3 A 20.2 00:06:35
12 0.464 281.9 2.220 2.2 A 20.2 00:07:05
13 0.509 284.9 2.166 2.2 A 20.2 00:07:35
14 0.554 287.7 2.115 2.1 A 20.2 00:08:05
15 0.599 290.3 2.069 2.1 A 20.2 00:08:35
16 0.644 292.5 2.029 2.0 A 20.1 00:09:05
17 0.689 294.2 1.997 2.0 A 20.1 00:09:35
18 0.734 295.9 1.966 2.0 A 20.1 00:10:05
19 0.779 297.6 1.937 1.9 A 20.1 00:10:35
20 0.824 299.0 1.911 1.9 A 20.1 00:11:05
21 0.869 300.6 1.882 1.9 A 20.1 00:11:35
22 0.903 301.8 1.860 1.9 A 20.1 00:12:05
23 0.936 303.0 1.839 1.8 A 20.1 00:12:35
24 0.957 303.6 1.827 1.8 A 20.1 00:13:05
25 0.973 304.1 1.818 1.8 A 20.1 00:13:36
26 0.988 304.5 1.811 1.8 A 20.1 00:14:06
27 1.003 305.0 1.803 1.8 A 20.0 00:14:36
28 1.018 305.4 1.795 1.8 A 20.0 00:15:07
Titration Results
Method Name: 1.8 pH Test
Time & Date: 14:25 Apr 11, 2022
Analyte Size:
End Point Volume: 1.008 mL
pH Fixed End Point: 1.800
Result: 1.008 mL
Initial & Final pH: 4.745 to 1.795
Titration Duration: 15:09 [mm:ss]
Titration went to Completion
Analyst Signature: ____________________
Appendix 2: Titrator data output files. The name “ingredient” is a default name. The program will use automatically use the ingredient name entered by the user for saving these files. The .mat file is a Matlab database file containing most of the information from the titration and processing. Matlab users can open this file and directly access the data fields. The database file is also useful for other programs that process titration data, including IngrendientDB (F. Breidt, unpublished).
1.) Ingredient.mat: Matlab database file containing one Matlab workspace variable (‘ingredient’) that has multiple fields. This variable represents an ABD class structure with the following fields representing model results and titration data, with notes for each field:
ingredient =
- buffer_table: [7×3 table] table of buffers (conc, pK)
- name: 'Ingredient' ingredient name
- conc: 100 ingredient concentration
- adjC: -0.0153 the salt of an acid/base or error term
- pH: 5.8870 model pH based on optimized adjC value
- totalBC: 0.0943 area under buffer model curve
- pH_cal: 0 electrode calibration adjustment
- titration: 1 Boolean for titration data (true/false)
- titration_name: "ingredient" ingredient name
- titration_conc: 100 ingredient concentration
- titration_IS: 0.3425 initial ionic strength for the titration
- titration_files: [1×1 struct] titration file names and data
- titration_ModelCurve: [100×2 double] buffer model smooth curve
- titration_BCcurve: [87×2 double] titration BC data
- titration_SCBCcurve: [100×2 double] trigonometric regression curve
- titration_buffertable: [7×4 table] table of buffers from the titration
- titration_SCBC: [1×1 struct] results the regression algorithm
- titration_SPX: [1×1 struct] results from the buffer model algorithm
- titration_SSE: 5.3846e-05 squared error sum for the buffer model
- titration_obspH: 5.8895 initial pH from the titration
- titration_volume: 0.0500 initial titration volume
- titration_HClconc: 2 normality of acid used for titration
- titration_NaOHconc: 2 normality of base used for titration
- parameters: [15×4 table] titration parameter table
- ver: '220701' version of the ADB database class
2) Ingredient_BCdatapoints.csv: comma delimited spreadsheet file with buffer capacity data points (i.e. Nx2 array with BC value, pK value).
3) Ingredient_BCmodelcurve.csv: comma delimited spreadsheet file with a smooth curve of buffer capacity data points model (i.e. Nx2 array with BC value, pK value).
4) Ingredient_buffertable.csv: comma delimited spreadsheet file with a table of buffers (i.e. Nx4 array with concentration (M), pK value, a_b letter [a=acid, b=base], and BC value).
5) Ingredient_graph.pdf: pdf file showing the BC graph (BC vs. pH)
6) Ingredient_info.csv: a data table showing data from the titration and processing:
- Ingredient concentration concentration (%) of the ingredient
- NaClpercent NaCl percent equivalent of ionic strength
- InitialVolume initial titration volume (L)
- AcidConc normality of the acid (HCl) used for titration
- BaseConc normality of the base (NaOH) used for titration
- MeasuredpH initial pH of the ingredient solution
- ModelpH model pH with adjC correction
- AdjC adjC value: salt of acid or base
7) Ingredient_paramfile.csv: saved parameters from the titration. This file may be edited and loaded for processing titration data using the “Open Parameter File” menu option. The values in the table represent the default parameter values, which are typically used for most food ingredient titrations:
Value Parameter Units Description (including algorithm used)
0.05 pH pH Data2Beta to generate curve w/o jumps
15 Order Int SCBCfit number of harmonics
0.001 MinConc Molar SCBCfit and SimplexBCPK_DF minimim buffer M/L
2 NaClpercent % SimplexBCPK_DF NaCl percent
7 NpKs Int SimplexBCPK_DF number of pKs for starting AB matrix
12 UB pH SimplexBCPK_DF upper pH range for BC curve fit
2 LB pH SimplexBCPK_DF lower pH range
0.2 pK_tol pH SimplexBCPK_DF pH range for too-similar pK vals
0 Trim_beg Int DriveFit trim off begining to balance end
0 Trim_end Int DriveFit trim off end to balance begining
0.3 MinGap Float Minimum gap in pH for not autofilling BC curve
0.1 Increment Float Increment pH value for gap filling of BC curve
2 HCl Normality Normality of HCl used for titration
2 NaOH Normality Normalty of NaOH used for titration
0.05 Init_Vol Liter Volume (L) of initial titration