
| Soft Wheat Quality Laboratory Materials and Methods |

|
- Quadrumat Milling Tests - Breeder Samples
- Modified Quadrumat Milling Method
- Breeding Samples
- Soft Wheat Quality Laboratory Testing Methods for Quality Traits
- Quality Materials and Methods References
- Genotyping
- Genotyping Materials and Methods References
Quadrumat Milling Tests - Breeder Samples
The Soft Wheat Quality Laboratory (SWQL) evaluates thousands of breeder wheat samples yearly. The following table summarizes the traits tested and reported to breeders by the SWQL. The SWQL milling methods are described below.
Table 1. Milling and baking measurements and calculations for evaluation of breeder samples
TRAIT | SYMBOL | DESCRIPTION / CALCULATION |
Whole Grain Protein | WPRO | Percent protein of whole, untempered grain measured on DA7200 near infrared (NIR) analyzer |
Whole Grain Hardness | Hard | Scale of 1-100, soft to hard. |
Grain Weight | GW | Weight of tempered, whole grain sample |
Bran | Bran | Weight of milled product retained by 40-mesh* screen |
Mids | Mids | Weight of milled product retained by 94-mesh* screen |
Break Flour | BkFl | Weight of milled product (excluding bran) passing |
Percent | % | Expressed as percent of grain weight |
Total Flour | Flour | Break Flour + Mids |
Flour Yield | FY | (Total Flour/GW) x 100 |
Softness Equivalence | SE | (BkFl/Total Flour) x 100 |
Flour Moisture | FMOIST | Percent moisture of wheat flour estimated by Unity NIR |
Flour Protein | FPRO | % protein of wheat flour by Unity NIR |
Cookie Diameter | Cookie Dia | Totaldiameter of 2 baked cookies (cm) |
Cookie Top Grain | Cookie TopG | 0-9 visual scale (0 worst, 9 best) |
Solvent Retention Capacity Tests | SRC | Percentage of solvent retained by a flour/solvent slurry after centrifugation and draining |
Lactic Acid | LA | ((residue wt/ flour wt)-1) x (86/(100 - %FMOIST)) x 100 |
* Mesh size is the number of openings in the SSBC screen per linear inch; smaller particles pass through higher mesh number.
Modified Quadrumat Milling Method
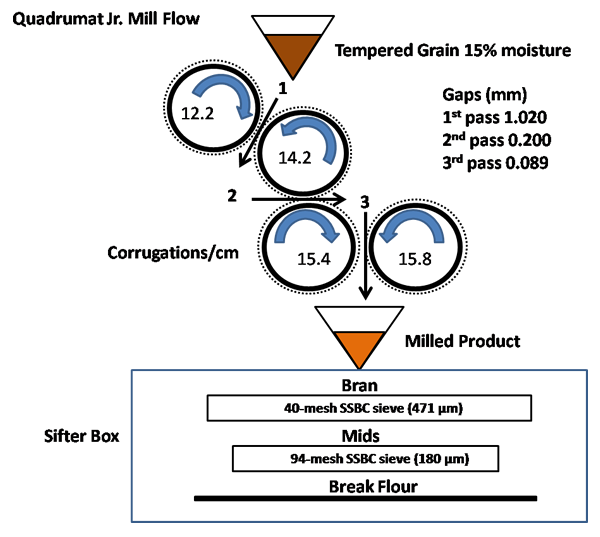
Tempering: Prior to milling, wheat grain is estimated for moisture content using a Perten NIR DA7200 whole grain analyzer and tempered to 15% moisture. Grain samples are tempered in glass jars by adding distilled water, sealing with silicon-free, screw-top lids and tumbling on a chain driven roller/conveyor (Lewco) until the water is absorbed, about 30 minutes. Tempered grain samples are kept sealed at room temperature for at least 24 hours prior to milling to allow moisture equilibration throughout the kernel.
For the preliminary group samples, tempered grain is fed into the Quadrumat break roll unit and passed through three sets of milling rolls, each with increasing corrugations per centimeter and decreasing gaps to decrease particle size sequentially from grain to flour (Figure 1 .)
Milled product is sifted on a Great Western sifter box through sequential 40- and 94-mesh stainless steel bolting cloth (SSBC) screens, with 471 and 180 micron openings, respectively, to separate the milled product into three fractions: bran, mids and break flour. Bran is recovered above the 40-mesh screen, mids above the 94-mesh screen, and break flour passes through the 94-mesh screen. For ease of handling and accuracy, the bran and mids fractions are weighed as an indirect method for calculating flour yield (grain sample weight less bran as a percent of total grain weight) and softness equivalence (break flour as a percent of total flour).
For the intermediate group and advanced group grain samples, middlings are further passed through the Quadrumat reduction roll unit to obtain shorts and reduction flour. The milled fraction is sifted on an 84-mesh screen (213 micron openings) to yield shorts and reduction flour. Break and reduction flours are combined, blended to produce straight grade flour and used for composition, SRCs and cookie baking tests. Bran yield, break flour yield and total flour yield are determined the same ways as described for the preliminary group samples. All samples are milled under controlled temperature and humidity (19 - 21oC and RH 58% - 62%). Mill temperature is equilibrated to 33oC ?1.0oC by running the mill empty prior to sample milling.
Bran yield (%) is the percentage of bran retained by a 40-mesh SSBC screen (471 micron opening size), over the grain weight. Break Flour Yield (%) is the percentage by weight of the flour sifted through a 94-mesh SSBC screen (180 micron) over the grain weight. Mids (%) is the percentage middling stock (retained by the 94-mesch screen) over the grain weight. Potential Flour Yield (%) is the percentage by weight of the sum of break flour and middling stock over the grain weight.
Figure 1 . Brabender Quadrumat Break Roll Unit Milling - adapted from Gaines, et al, 2000.
Breeding Samples
The SWQL treats samples as preliminary, intermediate oradvanced group samples. The difference in treatment for each test type is summarized in Table 27.
Preliminary group testing is for screening early generation selections, intermediate testing is used for intermediate generation samples and Advanced testing is for advanced breeding lines. Milling scores produced for all three sample treatments are determined in the same way.Intermediate and Advanced group testing add SRC and flour protein determinations, and Advanced grouptesting includes sugar-snap cookie baking.
Preliminary group testing involves grain characteristics (TW, Grain NIR for protein and kernel hardness) and milling properties for breeders to screen early generation lines. Grain is milled using the Quadrumat break roll unit to obtain bran, middling and break flour. Flour yield and softness equivalence are calculated based on the equations described in the milling methods, Table 26, above. No further tests are performed using the break flour.
Intermediate and advanced group samples are milled using both the break and reduction roll units to produce break and reduction flours. The blend of break flour and reduction flour (straight grade flour) is used for flour quality tests. Grain characteristics and milling properties (TW, Grain NIR for protein and kernel hardness, flour yield and softness equivalence) are determined as for the preliminary groups. In addition, straight grade flour is tested for protein content and solvent retention capacity (SRC) of sodium carbonate and lactic acid. For advanced group samples, the straight grade flour is used for the sugar-snap cookie baking test.
Table 2 . Differential processing of Preliminary, Intermediate and Advanced testing at SWQL.PROCEDURE | Preliminary | Intermediate | Advanced |
|---|---|---|---|
Sample Size | 80 g | 200 g | |
Test weight | Whole grain | ||
Milling Method | Break Roll Unit Milling | Break and Reduction Roll Units Milling | |
Flour Yield | Mids+Flour/Grain x 100 | ||
Softness Equivalence | (Break Flour/Total Flour) x 100 | ||
Hardness | DA7200 NIR | ||
Whole Grain Protein | DA7200 NIR | ||
Flour Test | NO | Straight Grade Flour | |
Flour Moisture/Protein Content | NO | YES - Unity NIR | |
Solvent Retention Capacity Tests (SRC) | NO | YES | |
Sucrose | NO | YES upon request | |
Lactic Acid | NO | YES (1-g test) | |
Water | NO | YES upon request | |
Sodium Carbonate | NO | YES (1-g test) | |
Sugar-snap Cookie | NO | YES | |
Sugar-snap Cookie | NO | YES | |
Soft Wheat Quality Laboratory Testing Methods for Quality Traits
Traits included in the SWQL evaluation of breeding samples, the method used, the purpose of the measurement and measurement units are summarized in Table 28. SWQL methods are described in detail below.
Table 3 . Traits measured at SWQL: methods, purpose and units
TRAIT | METHOD | INDICATES | UNITS |
Test Weight | Modified | Grain size, condition, | Estimated Pounds/bushel |
Hardness (SKCS) | Perten Single Kernel Characterization System (SKCS) | Grain hardness | 1-100 |
Hardness (NIR) | Near Infra Red (NIR) | Grain hardness | 1-100 |
Whole Grain Protein | Whole grain Protein content | Percent | |
Falling Number | AACC Method 56-81.03 | Pre-harvest sprouting damage | seconds |
Flour Yield | mids + break flour as % of initial grain weight | Flour recovery | Percent |
Softness Equivalence | Break flour weight as % of total flour weight | Estimates grain hardness, flour particle size | Percent |
Flour Ash | AACC Method 08-01 | Inorganic residue after combustion | Percent |
Flour Moisture | NIR | Flour moisture | Percent |
Flour Protein | Flour protein content | Percent | |
Solvent Retention Capacity Profile (SRC) | AACC Method 56-11.02 | Solvent affinity | Percent |
Lactic Acid | Gluten strength | ||
Sodium Carbonate | Damaged starch | ||
Sucrose | Content of Pentosans | ||
Water | Overall water affinity | ||
Sugar-snap Cookie Diameter | AACC Method 10-52 | Cookie spread | Centimeters |
Sugar-snap Cookie Top Grain | Visual quality cookie surface | 1-10 |
Whole Grain Moisture, Hardness, and Protein
Whole grain moisture, hardness and protein are measured using the NIR DA7200 Analyzer (Perten Instruments). Adjustment of calibrations was performed in Wooster, Ohio, for hardness, whole grain moisture and protein using values produced on the Single Kernel Characterization System (Perten Instruments), oven moistures (AACC Method 44-01.01) and nitrogen combustion analysis Rapid NIII Nitrogen Analyzer (Elementar), respectively.
Flour Yield
Flour yield is calculated as the percent total flour weight (break flour + mids) of the sample grain weight from a single pass through the Quadrumat break roll unit. For calculation of flour yield, the difference between the grain weight and the bran weight (over 40) is used.
FY = ((GW-Bran)/GW) x 100
The formula is equivalent to:
(Total Flour/GW) x 100
Softness Equivalence
Softness Equivalence (SE) is the percentage break flour (through 94-mesh screen) of the total flour weight (break flour plus mids). SE approximates grain softness and particle size of flour produced from a single pass through the Quadrumat break roll unit (C.W. Brabender Instruments, Inc.) and is analogous to break flour in a large-scale mill (Finney, 1986). Total flour weight is calculated by subtracting bran weight (remaining over the 40-mesh screen) from initial grain weight. Subtracting the weight of the mids (remaining over the 94-mesh screen) from the total flour gives the weight for break flour. SE = (GW - Bran - Mids)/(GW - Bran) x 100
This formula is equivalent to:
(BkFl/Total flour) x 100
Flour Moisture and Protein
Flour moisture and protein are estimated using the SpectraStar NIR analyzer (Unity Scientific), calibrated yearly for protein by nitrogen combustion analysis using the Rapid NIII Nitrogen Analyzer (Elementar) and for moisture by the oven drying method (AACC method 44-01.01). Units are recorded in percent moisture or protein converted from nitrogen x 5.7 and expressed on a 14% moisture basis.
Flour protein of 8% to 9% is representative for breeder's samples and SWQL grow-out cultivars. As flour protein increases, the expansive capability of the cookie during the baking process tends to decrease. Flour protein is controlled more by climatic conditions and cultural practices, and less by genetic variation.
Protein quality is an evaluation of gluten strength and is not the same as protein quantity. A cultivar low in protein quantity potential of grain could still exhibit strong gluten strength. Soft wheat of relatively strong protein is desirable for cracker production. Gluten strength is estimated using a mixograph and graded on a scale of 1 to 8, weakest to strongest gluten. Evaluation of gluten strength using the mixograph or farinograph is difficult for soft wheat flours that are 8.5% protein and lower. Lactic acid SRC does not require dough mixing for assessment of gluten strength and tends to be a better measurement of protein quality when evaluating soft wheats.
Solvent Retention Capacity
Solvent Retention Capacity (SRC) assays are performed as described in AACC Method 56-11.02, Solvent Retention Capacity Profile. The profile of SRCs in the four solvents (sucrose, lactic acid, sodium carbonate and water) is used to predict milling and baking quality. In general, lower SRCs are preferred for water, sodium carbonate and sucrose solvents (Kweon, Slade, & Levine, 2011)
Breeder samples processed by intermediate and advanced group testing use straight grade flour (blend of break and reduction flours) for SRC tests.
With the exception of sucrose, SRCs are performed using 1 gram of flour in glass test tubes with rubber stoppers. Sucrose SRCs are performed with 5 grams of flour in 50 mL disposable screw top centrifuge tubes, because the highly viscous sucrose solution impedes even distribution of solution in 1 gram flour tests, reducing the reliability of the small scale test.
SRC Biochemistry and Correlations to Traits
The following descriptions of the biochemistry and correlations of SRCs with milling and baking traits were published in the Soft Wheat Quality Laboratory Annual Report 2011 (Souza, Kweon, & Sturbaum, 2011).
WaterSRC is a global measure of the water affinity of the macro-polymers (starch, arabinoxylans, gluten, and gliadins). Lower water values are desired for cookies, cakes, and crackers, with target values below 51% on small experimental mills and 54% on commercial or long-flow experimental mills.
Sucrose SRC values are related to content of arabinoxylans (also known as pentosans), which can strongly affect water absorption in baked products. Sucrose SRC is a good predictor of cookie quality and shows a negative correlation with wire-cut cookie diameter (r = -0.66, p<0.0001). The cross hydration of gliadins by sucrose also causes sucrose SRC values to be correlated to flour protein (r = 0.52) and lactic acid SRC (r = 0.62). The 95% target value can be exceeded in flour of high lactic acid SRC.
Sodium carbonate SRC takes advantage of the very alkaline solution to ionize the ends of starch polymers increasing the water binding capacity of the molecule. Sodium carbonate SRC increases as starch damage due to milling increases.
Lactic acid SRC predicts gluten strength of flour. Typical values are below 85% for "weak" protein soft wheat varieties and above 110% for "strong" protein soft wheat varieties. Lactic acid SRC results correlate to the SDS-sedimentation test. The lactic acid SRC is also correlated to flour protein concentration and dependent on genotypes and growing conditions.
Cookie Bakes (sugar snap cookies)
Two sugar snap cookies are baked in the SWQL bake laboratory for each sample as described in AACC Method 10-52, Baking Quality of Cookie Flour. Cookies are baked exclusively for advanced group samples using straight grade flour (blend of break and reduction flours). Diameter of the two cookies is measured and recorded electronically using a Mitutoyo Absolute Digimatic Caliper. Cookies are graded visually for surface appearance and color, from worst to best on a scale of 1 to10.
Falling Number
The falling number test (AACC Method 56-81B) measures the travel time of the plunger in seconds (falling number) from the top to the bottom position in a glass tube filled with a suspension of whole grain meal or milled flour, immediately after being cooked in a boiling water jacket to produce gelatinized starch. The higher the viscosity of whole grain meal or flour paste in the glass tube, the longer the travel time of the plunger. The enzyme a-amylase, produced when grain sprouts, hydrolyzes starch molecules and lowers viscosity of gelatinized starch, resulting in a decreased travel time of the plunger (falling number). The test is performed using the Perten Falling Number Instrument. Alpha-amylase can be measured directly using a kit from Megazyme, International (AACC Method 22-02-01, Measurement of alpha-Amylase in Plant and Microbial Materials Using the Ceralpha Method). The SWQL uses a modified micro method of the Megazyme assay.
Flour Ash
Flour Ash is measured according to the AACC method 08-01 and detects residual inorganic materials after combustion. Since inorganic materials are higher in bran than in endosperm, flour ash is an indirect indicator of residual bran in the flour.
Quality Materials and Methods References
Finney, P. A. (1986). Revised Microtesting for Soft wheat Quality Evaluation. Cereal Chemistry , 177-182.
Gaines, C. F. (2000). Developing agreement Between Very Short Flow and Longer Flow Test Wheat Mills. Cereal Chemistry , 187-192.
Kweon, M., Slade, L., & Levine, H. (2011). Solvent Retention Capacity (SRC) Testing of Wheat Flour: Principles and Value in Predicting Flour Functionality in Different Wheat-Based Food Processes and in Wheat Breeding-A Review. Cereal Chemistry, 88, 537-552.
Souza, E., Kweon, M., & Sturbaum, A. (2011). Research Review. USDA-ARS Soft Wheat Quality Laboratory.
Genotyping
DNA markers applied in marker assisted selection and genotyping are included below. The SWQL sends samples to the Eastern Regional Small Grains Genotyping Laboratory for SNP genotyping.
Molecular markers and protocols are available at the University of California Davis website:
Quality Genotyping - Primer Sequences, amplification conditions and references
The molecular markers described below are the most commonly used markers at the SWQL. These are reliable and robust reactions that have been useful in assessing wheat quality. Primer sequences are 5' to 3'.
High Molecular Weight Glutenins and ?-gliadin
GluA1
AxFwd | ATGACTAAGCGGTTGGTTCTT |
Ax1 R | ACCTTGCTCCCCTTGTCCTG |
Ax2* R | ACCTTGCTCCCCTTGTCTTT |
Amplifies at 58? C, 1,200 bp product, present or absent using single forward primer, alternate (Ma et al., 2003), (Liu et al., 2008)
GluD1
DxL_151 | AGGATTACGCCGATTACGTG |
Dx2R ``2+12" | AGTATGAAACCTGCTGCGGAG |
Dx5R ``5+10'' | AGTATGAAACCTGCTGCGGAC |
Amplifies 664 bp product, present or absent using single forward primer, alternate reverse primers, touch down amplification.
(Wan et al., 2005)
GluB1
Bx7oe_L1 | GCGCGCTCAACTCTTCTAGT |
Bx7oe_R1 | CCTCCATAGACGACGCACTT |
Amplifies at 64? C a 404 bp for wild-type or 447 bp product for over-expressing Bx7.
(Lei et al., 2006)
?-gliadin
GligDF1 | AAGCGATTGCCAAGTGATGCG |
GligDR1 | GTTTGCAACACCAATGACGTA |
GligDR2 | GCAAGAGTTTGCAACAGCG |
Amplifies at 56? C, a 264 bp product for gliadin 1.1 or or 270 bp product for gliadin 1.2, using single forward primer, alternate reverse primers.
(Zhang et al., 2003)
Translocations and Disease Resistance
1B/1R and 1A/1R - Chromosome 1B or 1A substituted with rye secalin
Tailed Reaction
| SCM9_L_M13 | CACGACGTTGTAAAACGACTGACAACCCCCTTTCCCTCGT |
SCM9_R | TCATCGACGCTAAGGAGGACCC |
Amplifies using a tailed reaction, 207 bp for 1B/1R or or 203 bp for 1A/1R.
(De Froidmont)
2B translocation - Sr36 stem rust resistance
Stm773-F5 | AAACGCCCCAACCACCTCTCTC |
Stm773-R5 | ATGGTTTGTTGTGTTGTGTGTAGG |
Amplifies with 62/55? C touchdown program producing a 162 fragment indicative of the 2B translocation carrying Sr36 or 192 bp for wild type 2B.
(Tsilo et al., 2008)
Sucrose Synthase type 2 Sus2
HapH | higher grain weight (Sus2-SNP-185/592h2) |
Sus2-SNP-185 | TAAGCGATGAATTATGGC |
Sus2-SNP-589h2 | GGTGTCCTTGAGCTTCTgG |
Hap L | associated with low grain weight |
Sus2-SNP-227 | ctataGTATGAGCTGGATCAATGGC |
Sus2-SNP-589L2 | GGTGTCCTTGAGCTTCTgA |
Amplifies each of the primer pairs independently at 52? C to produce a 423 (HapH) or 381 bp (HapL) fragment. Haplotypes indicate high or low grain weight, respectively.
(Jiang et al., 2011)
Pre-harvest sprouting
Vp1BF | TGCTCCTTTCCCAATTGG |
Vp1BR | ACCCTCCTGCAGCTCATTG |
Amplifies at 62? C a 569 or 845 bp fragment for reported tolerance to preharvest sprouting.
(Yang et al., 2007)
Genotyping Materials and Methods References
De Froidmont, D. (1998). A Co-dominant Marker for the 1BL/1RS Wheat-rye Translocation via Multiplex PCR. J. Cereal Sci. 27, 229-232.
Jiang, Q., Hou, J., Hao, C., Wang, L., Ge, H., Dong, Y., and Zhang, X. (2011). The wheat (T. aestivum) sucrose synthase 2 gene (TaSus2) active in endosperm development is associated with yield traits. Funct. Integr. Genomics 11, 49-61.
Lei, Z.S., Gale, K.R., He, Z.H., Gianibelli, C., Larroque, O., Xia, X.C., Butow, B.J., and Ma, W. (2006). Y-type gene specific markers for enhanced discrimination of high-molecular weight glutenin alleles at the Glu-B1 locus in hexaploid wheat. J. Cereal Sci. 43, 94-101.
Ma, W., Zhang, W., and Gale, K.R. (2003). Multiplex-PCR typing of high molecular weight glutenin alleles in wheat. Euphytica 134, 51-60.
Tsilo, T.J., Jin, Y., and Anderson, J.A. (2008). Diagnostic Microsatellite Markers for the Detection of Stem Rust Resistance Gene in Diverse Genetic Backgrounds of Wheat. Crop Sci. 48, 253.
Wan, Y., Yan, Z., Liu, K., Zheng, Y., D'Ovidio, R., Shewry, P.R., Halford, N.G., and Wang, D. (2005). Comparative analysis of the D genome-encoded high-molecular weight subunits of glutenin. Theor. Appl. Genet. 111, 1183-1190.
Yang, Y., Zhao, X.L., Xia, L.Q., Chen, X.M., Xia, X.C., Yu, Z., He, Z.H., and R?der, M. (2007). Development and validation of a Viviparous-1 STS marker for pre-harvest sprouting tolerance in Chinese wheats. Theor. Appl. Genet. 115, 971-980.
Zhang, W., Gianibelli, M.C., Ma, W., Rampling, L., and Gale, K.R. (2003). Identification of SNPs and development of allele-specific PCR markers for ?-gliadin alleles in Triticum aestivum. Theor. Appl. Genet. 107, 130-138.