
| PAM Slide Set - 1996 |

|
This slide set represents a summary of the research of Bob Sojka & Rick Lentz on polyacrylamide (PAM) which was presented at the PAM conference on Managing Irrigation-Induced Erosion with PAM on May 6-8, 1996. Slide sets are no longer available. The following are thumbnails of all the slides in the set together with text from each slide. To view a larger picture of each slide, click on the thumbnail.
 1. Fighting Irrigation-Induced Erosion with Polyacrylamide (PAM)
A Summary of Research Findings and Application Tips from
USDA Agricultural Research Service
Northwest Irrigation and Soils Research Laboratory Kimberly, Idaho
R.D. Lentz and R.E. Sojka
 2.Extent of Irrigated Agriculture
- Worldwide Cropped Acres: 3.0 - 3.5 billion
- Irrigated Cropped Acres: 600 million (15 - 17%)
- Total US Irrigated Crop Acres: 59.5 million (14.8%)
- Surface flow: 32.5 million Sprinkler: 24.5 million Other: 2.5 million
- 17 Western States total: 46.5 million
 3.Importance of Irrigated Agriculture
- Irrigation occurs on 1/6 of global & US cropped acres
- 1/3 the annual global & US harvest
- 1/2 the monetary value of crops harvested 125 million irrigated A. produce 1/3 the global food harvest
- Irrigation frees 1.2 billion acres for nature (36 Iowas)
- Greater food security, i.e. yield reliability
- Common side-benefits: flood control, transport, recreation, hydropower
 4. Importance of Irrigated Agriculture
- Predominant Association with Aridity
- Greater photosynthetic efficiency
- Less: soil-incorporated herbicide, fungicide, pesticide, lime, potash
- Displaces fewer species
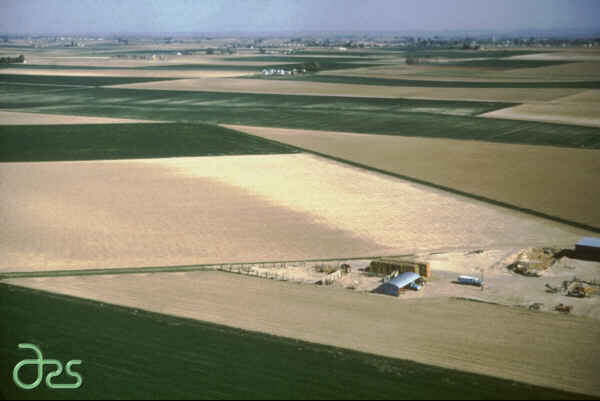 5. Aerial photo of "white soils"
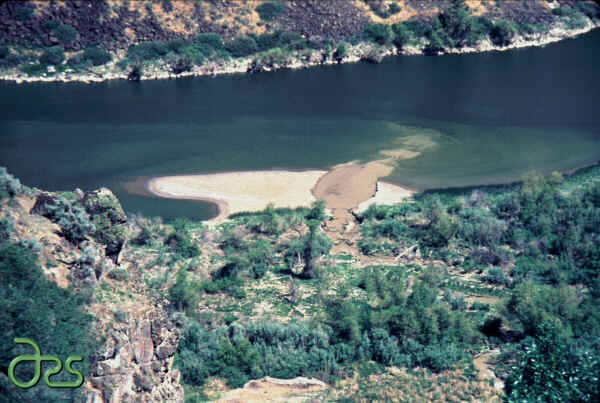 6. Aerial photo of Sediment buildup in Snake River return flow
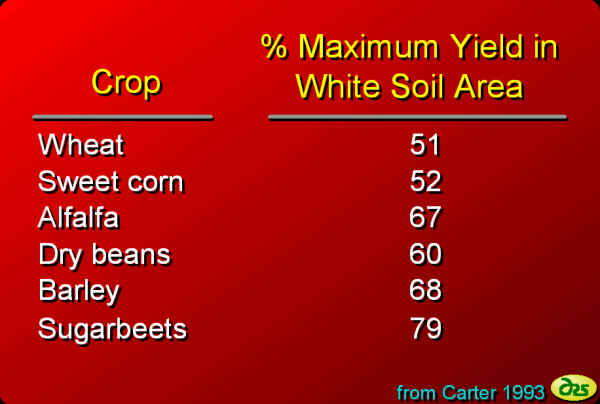 7. % Maximum Yield in White Soil Areas
- Wheat 51
- Sweet corn 52
- Alfalfa 67
- Dry beans 60
- Barley 68
- Sugarbeets 79
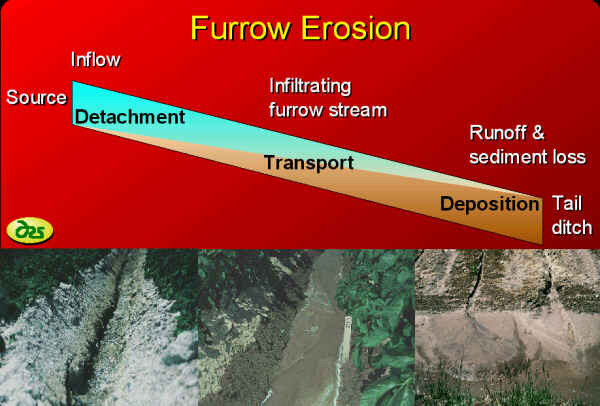 8.Furrow Erosion Diagramshowing Detachment, Transport, and Deposition of Sediment
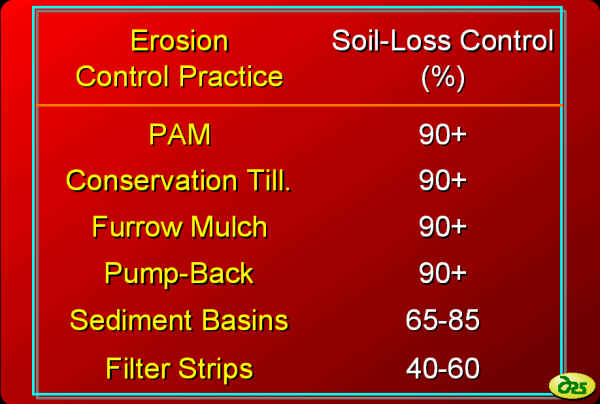 9.Erosion Control Practice and Soil Loss Control (%)
- PAM 90+
- Conservation Tillage 90+
- Furrow Mulch 90+
- Pump-Back 90+
- Sediment Basins 65-85
- Filter Strips 40-60
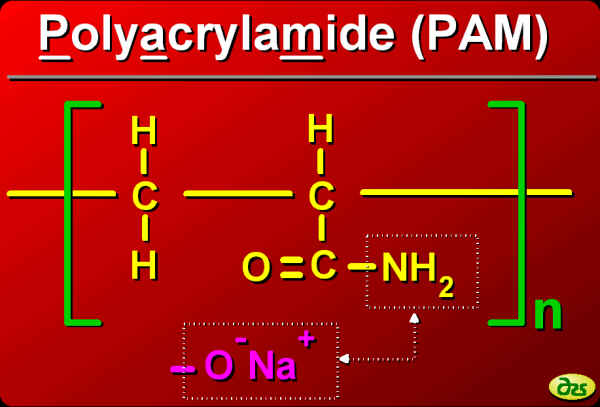 10.Diagram of PAM molecule
 11.Anionic PAMs are "Off the Shelf " Industrial Flocculants. Used Extensively for:
- Potable Water Treatment
- Dewatering of Sewage Sludges
- Washing and Lye-Peeling of Fruits and Veg's
- Clarification of Sugar Juice and Liquor
- Adhesives and Paper in Contact with Food
- Animal Feed Thickeners & Suspending Agents
- Cosmetics
- Paper Manufacturing
- Various Mining and Drilling Applications
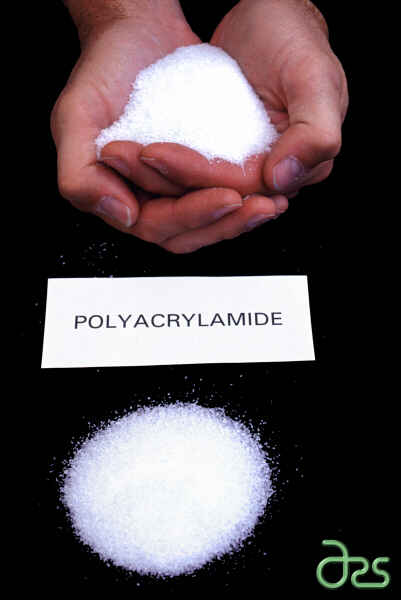 12.Photo of PAM crystals
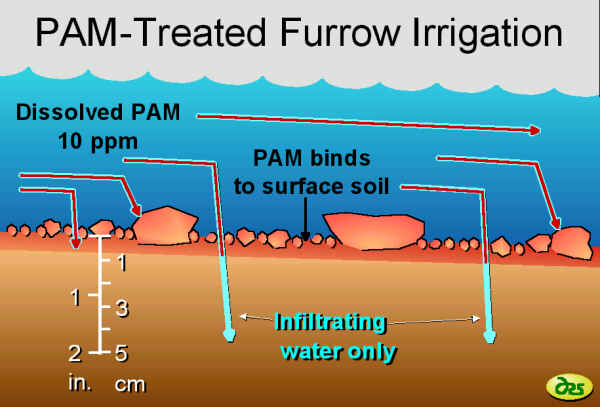 13.PAM Treated Furrow Irrigation.Diagram of PAM binding to soil surface.
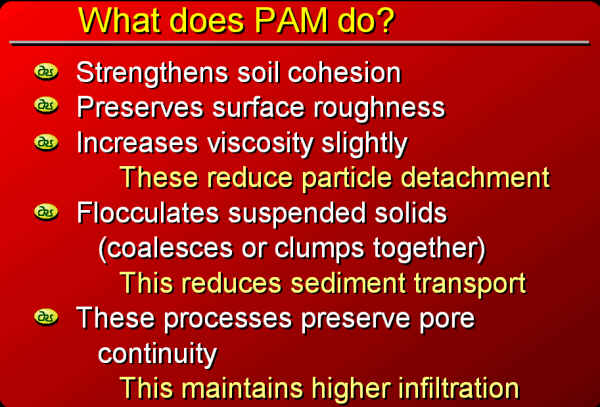 14. What Does PAM Do?
- Strengthens soil cohesion
- Preserves surface roughness
- These reduce particle detachment
- Flocculates suspended solids (coalesces or clumps together)
- This reduces sediment transport
- These processes preserve pore continuity
- This maintains higher infiltration
 15.Photo showing effect of PAM on aggregate stabilization
 16.Photo showing PAM flocculation of suspended soil particles
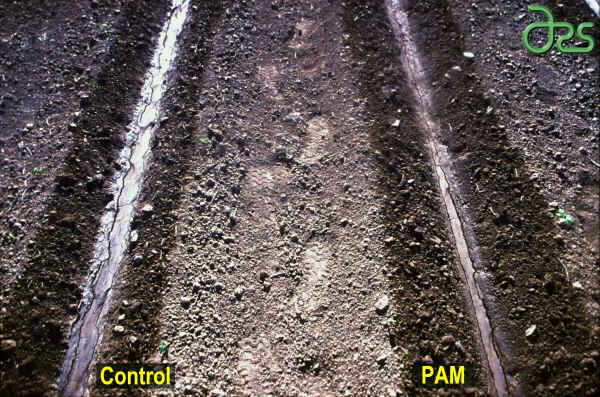
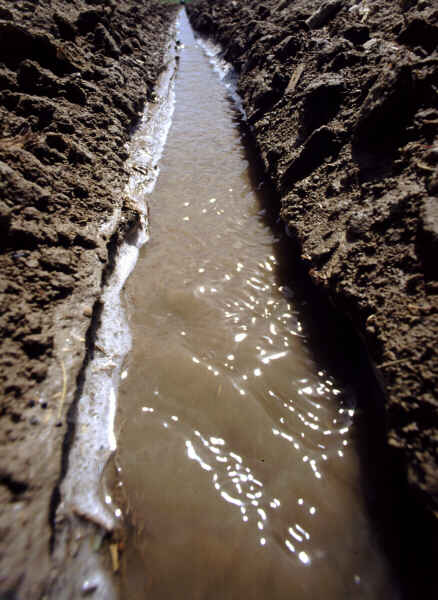 17.Photo of control furrow showing cloudy water and erosion
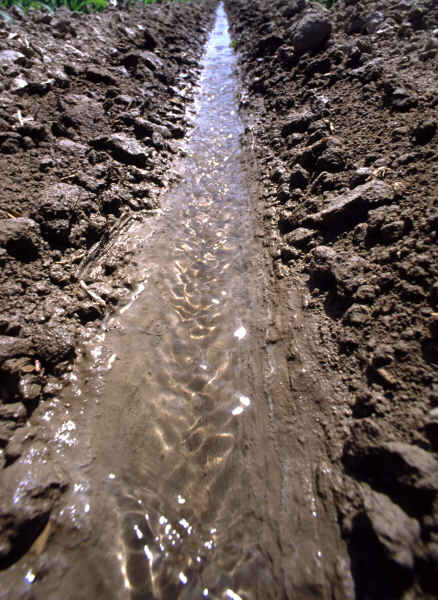 18.Photo of PAM treated furrow showing clear water and no erosion
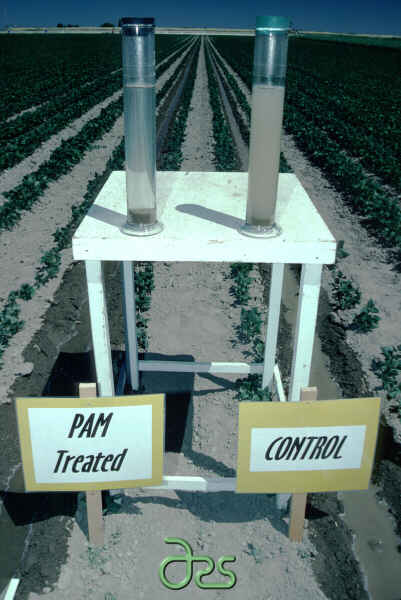
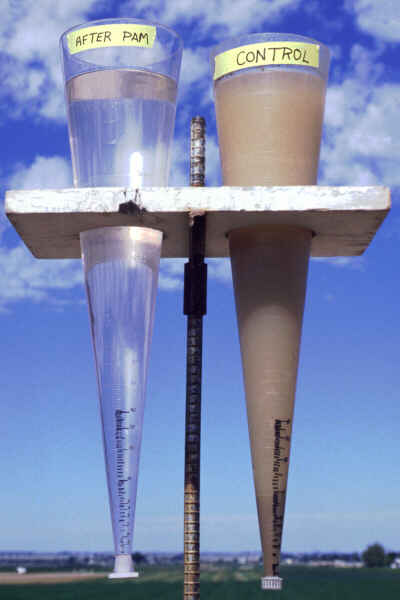 19.Photo of PAM vs Control runoff samples in Imhoff cones
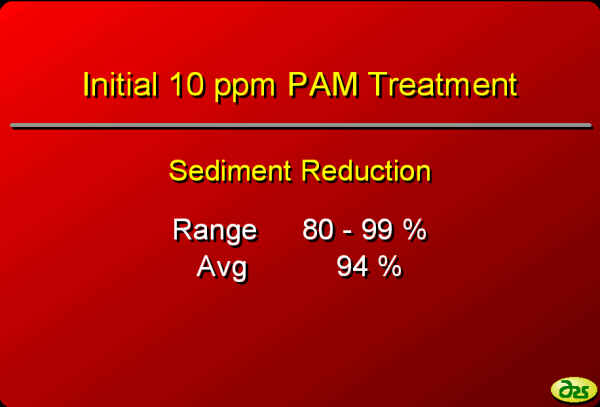 20.Initial 10 ppm PAM Treatment
- Sediment Reduction
- Range 80 - 99 %
- Avg 94 %
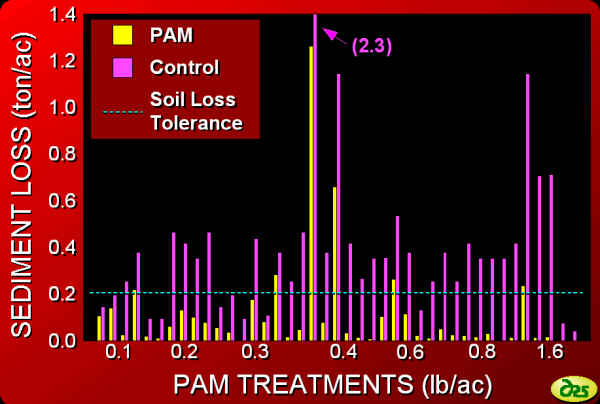 21.Graph of Sediment Loss vs PAM Treatments
 22.Graph of Soil Loss vs Time during an irrigation
 23.Graph showing PAMs potency on different slopes
 24.PAM Effects on Infiltration
- Soil dependent
- Net increases
- 15 % on silt loams
- 50 % on clays
- 25 % increase in lateral wetting on shallow furrows
 25. Photo showing PAM effect on lateral wetting
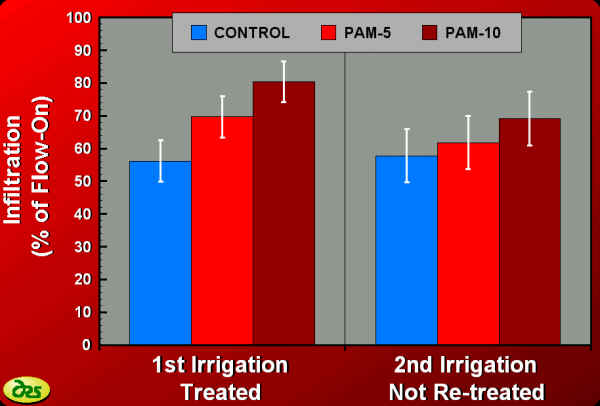 26.Graph of Infiltration Increase with PAM at 5 and 10 ppm
 27.Graph showing mean runoff losses
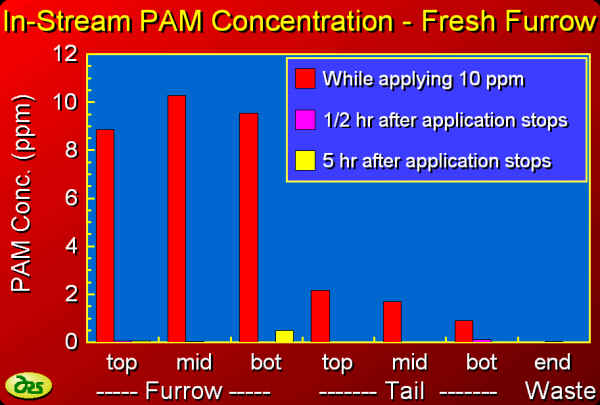 28. Graph of in-stream PAM concentrations for a fresh furrow
 29.PAM Application Safety (<10ppm)
- EPA and FDA approved as food and water additives
- No known toxicities in soil/water
- Monomer content controlled
- No accumulation in crops
 30.Persistence in Soil
- PAM N-groups quickly consumed by microorganisms
- PAM carbon backbone more resistant, UV & mech. shear (degrades 10%/yr)
- Monomer biodegrades rapidly in soil, <18 hour half-life in soil
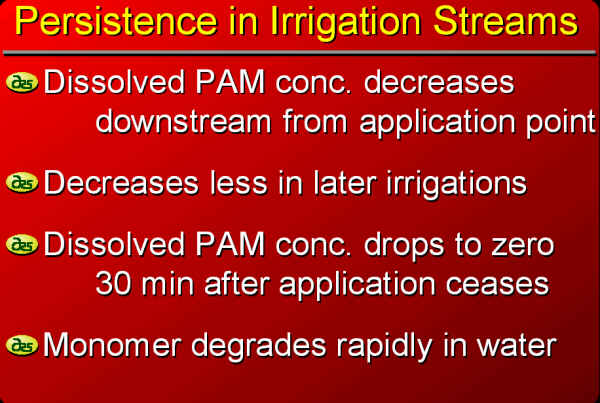 31.Persistence in Irrigation Streams
- Dissolved PAM conc. decreases downstream from application point
- Decreases less in later irrigations
- Dissolved PAM conc. drops to zero 30 min after application ceases
- Monomer degrades rapidly in water
 32.NRCS PAM Interim Standard
- Labelled water soluble (not crosslinked) product only
- High Mol Wt (15 Mg mol-1)
- Moderate anionic (-) charge (18%)
- < 0.05 % AMD
- Treat disturbed furrow (10 ppm in adv.)
- PAM must be in water before reaching frw
- Considerations
- Mix thoroughly
- Mix-in slowly
- Turbulence w/dry applicators
- Maybe individual furrow treatment w/dry or emulsion PAM
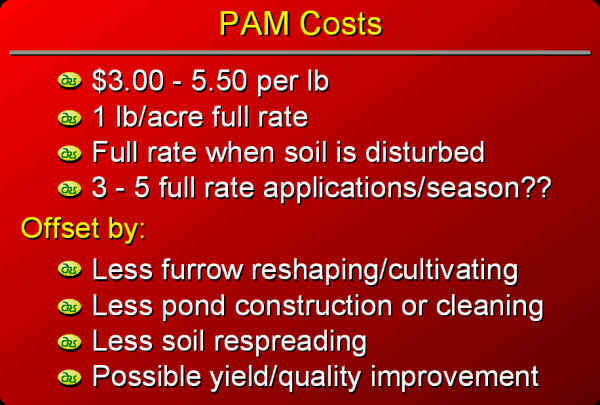 33.PAM Costs
- $3.00 - 5.50 per lb
- 1 lb/acre full rate
- Full rate when soil is disturbed
- 3 - 5 full rate applications/season??
Offset by:
- Less furrow reshaping/cultivating
- Less pond construction or cleaning
- Less soil respreading
- Possible yield/quality improvement
 34.Granular PAM-Ditch Applicator Cost
- gandy/auger head ditch applicators
- $225-550 electric motor (battery)
- $400-550 paddle wheel
- $800+ electric & auto timing
- some are easily portable
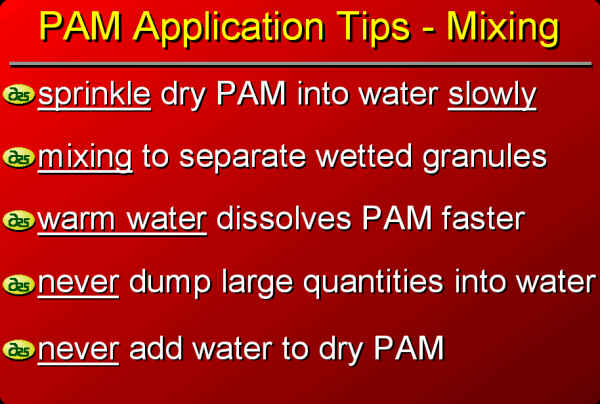 35.PAM Application Tips - Mixing
- sprinkle dry PAM into water slowly
- mixing to separate wetted granules
- warm water dissolves PAM faster
- never dump large quantities into water
- never add water to dry PAM
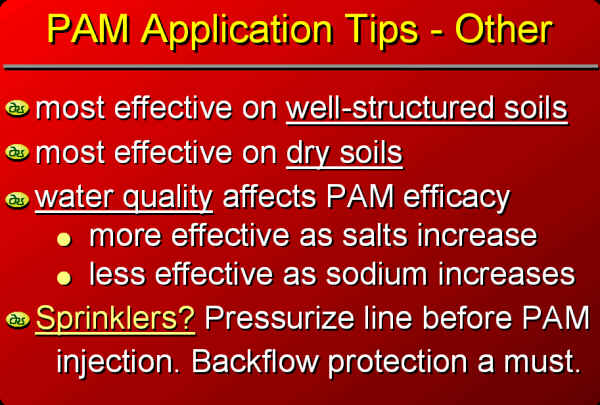 36.PAM Application Tips - Other
- most effective on well-structured soils
- most effective on dry soils
- water quality affects PAM efficacy
- more effective as salts increase
- less effective as sodium increases
- Sprinklers? Pressurize line before PAM injection. Backflow protection a must.
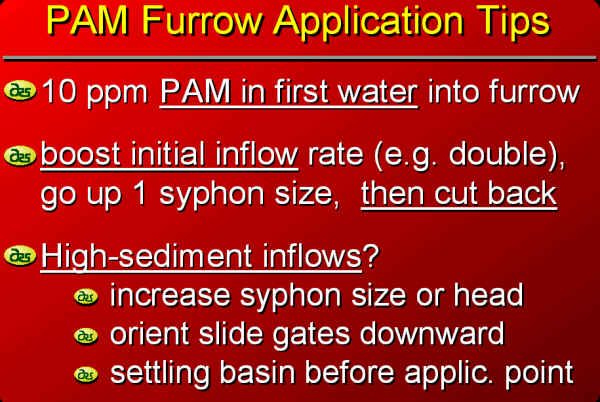 37.PAM Furrow Application Tips
- 10 ppm PAM in first water into furrow
- boost initial inflow rate (e.g. double), go up 1 syphon size, then cut back
- High-sediment inflows?
- increase syphon size or head
- orient slide gates downward
- settling basin before applic. point
 38.Other PAM Research Thrusts
- Furrow PAM application methods
- Granular patch - Emulsion - Drip line
- Sprinkler Irrigation
- Injection technology / rates / benefits
- Anti crusting properties
- Application methods / rates / benefits
- Non agricultural uses
- Construction site protection
- Sediment / holding-pond treatment
- Dryland - the real challenge
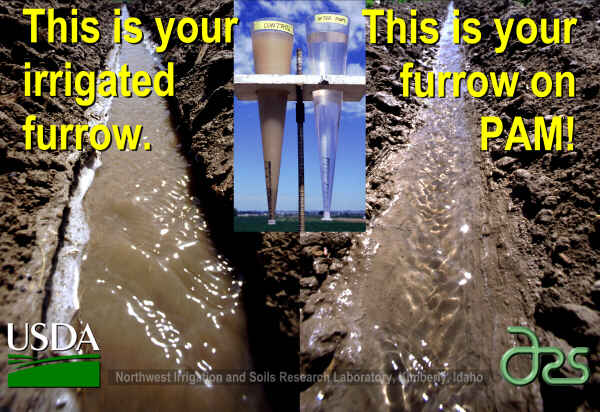 39.This is your irrigated furrow. . . This is your furrow on PAM!
Last Updated on April 7, 1997 by Jim Foerster