United States Department of Agriculture
AgResearch Magazine


Tailoring Rice To Suit Consumers
|
|
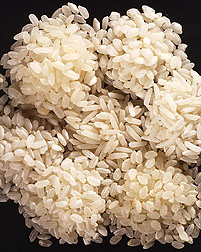
Sushi rice is sticky rice by American notions of quality texture. But stickiness is what holds the raw fish and seaweed together in that Japanese specialty.
More than half of American-grown rice is exported, so it's important to understand cultural differences when it comes to developing this widely used grain.
[See "Disease-Resistant Rice Varieties" for the latest U.S. varieties.]
Scientists with the Agricultural Research Service are using cutting-edge technology and trained sensory panelists to evaluate American rice varieties for Asian markets.
ARS chemist Franklin E. Barton heads the Quality Assessment Research Unit at Athens, Georgia. He and Elaine T. Champagne, who is in charge of ARS' Food Processing and Sensory Quality Research Unit at the Southern Regional Research Center in New Orleans, Louisiana, have traveled to Japan several times and found that consumers' tastes in food differ from Americans' in many ways.
"The Japanese palate can detect subtle nuances in rice quality that U.S. consumers just can't perceive,"Barton says. "Here at home, most people cover their rice with gravy. But in Japan, the rice is almost an art form. The food there has to be as beautiful to look at as it is flavorful to eat."
During milling, U.S. rice processors remove the outer hull and by so doing, for white rice, remove about 15 percent by weight of the grain's outer layers. Japanese consumers like whiter rice varieties and sometimes mill their rice a little deeper.
"When I go to the store at home,"Champagne says, "there're generally one or two brands of medium- and long-grain rice. In Japan, you find rice connoisseurs who want variety and prefer their rice fresh-milled within days of purchase. In the United States, weeks or months may pass from milling to market."
There is no one right way for rice to taste. But the relative amounts of protein and starch in rice play a big role in its flavor and texture.
|
|

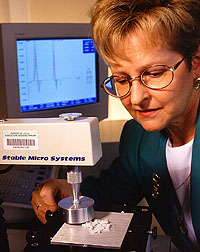
ARS scientists are using near-infrared reflectance (NIR) technology in studies to evaluate the chemical makeup of rice. They use other instruments to check the physical pressure needed to chew it. And the scientists complement their research with trained sensory panelists, because eating is an experience that involves several senses simultaneously. Rice evaluation can't be reduced to just a mechanical process.
So what do these machines --and their human counterparts --actually reveal? Americans like their rice to cook firm, with kernels that break apart easily; that happens when rice is high in protein and amylose, or rice starch. Japanese prefer a rice that cooks soft and sticky --as when protein and amylose are low.
Getting Rice To Measure Up
What's needed is a way to evaluate rice so the right variety goes to the right consumer. By combining human and mechanical evaluations, researchers hope to find effective tools for analysis.
"Japanese want a rice that is about 18 percent amylose, and they want 5 percent protein or less,"says Barton. "American rice ranges from 13 to 25 percent amylose and 5 to 9 percent protein. Our rice is diverse enough to offer the Japanese suitable varieties."
The NIR instrument can determine the starch-protein ratio in rice with high precision by measuring light just beyond the visible spectrum.
When a rice sample is exposed to a precisely defined amount of near-infrared light waves, a computer measures the reflectance --how much light energy bounces back. Each food component has a characteristic reflectance.
To be effective, NIR equipment has to be calibrated correctly. It works based on many samples in its database. When a new NIR reading is taken, the computer compares the results only to the other evaluations already in its database.
|
|
"If you are trying to evaluate U.S.-grown brown rice and all your previous samples are Japanese white rice, you will get a bad reading,"says Barton. "But if you add a sufficient number of brown rice samples, then rice color won't confuse readings on other unrelated characteristics, such as amylopectin and amylose."
Barton demonstrated that any correctly calibrated NIR system could measure rice constituents and would often give good marks to U.S. rice. This prompted an international re-evaluation of how rice quality is determined.
If NIR technology could be calibrated for samples of every kind of rice grown in the world, it might be possible to have a global quality evaluator for rice that could be simply calibrated for whatever market was wanted --American high-protein, Asian high-starch, or even Indian aromatic.
A Global Taste Test
In working with Japanese scientists and others, "one of our goals all along has been to develop a universal taste tester,"says Champagne. "This instrument would give an indication of what sensory properties a rice has, allowing you to find the most appropriate and highest value market for that rice."
This universal taster is not yet perfected. But the work done in Athens and New Orleans has already helped Foss North America, Inc., an international food evaluation company, to develop a new international-style rice taste-texture analyzer. It's being sold throughout Australia, with more markets planned.
To make an NIR system mimic the sensory evaluation of a person, it is necessary to first start with what humans experience when eating a food like rice.
That's where Athens food scientists Bob Windham and Brenda G. Lyon played a vital role. They joined forces with Champagne and her colleague, Karen L. Bett, to do the human taste and texture evaluations and apply them to NIR.
Lyon and Bett are experts at taste and texture panels. But their task was a big one. The first experiment involved examining the effects of drying conditions, moisture content, and degree of milling on four short- and medium-grain rice varieties grown in the United States.
Samples of each of the four varieties were obtained from four rice-growing states --Arkansas, Louisiana, Texas, and California. The scientists looked at the effects of five kinds of drying methods, two moisture levels, and two kinds of milling on each variety, evaluating a total of 220 samples: 110 for texture and 110 for flavor.
|
|
And that's how they split up the work: Bett did flavor; Lyon did texture. The two scientists each led a team of eight trained panelists in sampling the rice. The panelists had to have naturally sensitive palates.
But why so many samples? Because Americans and Japanese process rice differently, U.S. rice producers usually give their customers 12 percent moisture, while Japanese growers go with about 15 percent. Most U.S. producers dry their rice mechanically, but some Japanese growers air-dry their rice right in the field.
Because the Japanese palate is more sensitive to rice flavor than that of most U.S. consumers, Bett's group faced the special challenge of finding objective new ways to describe the properties of cooked rice based on flavor intensity, odor, and mouth feel.
Some rice, for example, confers a buttery smell and sweet, cornlike flavor that the researchers aptly describe as popcorn. Other samples bring to mind the pleasing scent of dried lilac or lavender, and are thus described as floral. A pungent, sulfurous smell earned other samples the less complimentary moniker of "sewer animal."
Not surprisingly, "Our panelists learned that rice doesn't just taste like rice,"says Champagne. Then Bett went on to do another flavor and texture project using her panelists to evaluate more than 100 different kinds of rice from around the world.
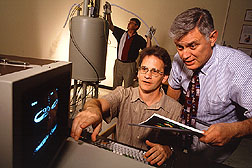
After the panelists did their job, Windham's expertise came into play. His skill in mathematics and computer science allowed him to "train"the NIR systems in evaluating quality based on the human data.
After Bett's and Lyon's panelists rated texture and flavor characteristics by numbers --ranging from 1 for not sticky to 10 for glutenous or gluey --Windham had to turn the rankings into equations the NIR computer could understand.
Windham and Lyon had worked on applying panel data to NIR systems before, in a study of fresh and frozen poultry. However, the rice project was much more extensive, and flavor and texture data with many subtle differences had to be uncovered.
"You can never replace human taste evaluation, but near-infrared can be a complement,"said Windham. "The trick is linking descriptive sense to NIR's world of numbers and calculations."
Getting to the Root of Differences
Evaluating the rice wasn't enough, either. Researchers also needed to understand why different flavor and textures occur. The answer lay only partly in the complex interaction of protein, moisture, and amylose, says Champagne.
Another mystery: Japanese consumers tend to prefer short grains over long. Short varieties tend to be low in amylose, and long grains are usually high. Barton's theory is that components, such as starch and protein, in short and long grains may also be bound together differently.
|
|
Too, outside factors can play a significant role in sensory qualities. Over the past few years, ARS and other food scientists have gained new insight into subtle ways that mechanical harvesting, milling, and other practices can alter cooking properties of rice.
Lyon confirmed previous findings that texture could be affected by whether a particular rice is grown in Arkansas or California. Japanese consumers are known to prefer California-grown varieties.
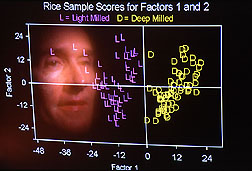
Deep milling --that is, removing more than 15 percent of the grain's outer layers --can increase stickiness, but it's an expensive option for producers.
Making rice fit Asian markets is vital to U.S. growers.
The opportunity to reach the Japanese market opened under the 1994 General Agreement on Tariffs and Trade. For the first time, the United States could export rice to Japan. Since that market opened, researchers at ARS' National Rice Germplasm Evaluation and Enhancement Center at Stuttgart, Arkansas, have collected germplasm of Japanese varieties to evaluate for U.S. growers.
"Genetic engineering lets us make breeding changes sooner, based on consumer tastes,"Lyon says. "It's important that we give growers the yields they need, but we also need to think of our customers when we export to Japan."
This new open market may also change Americans' tastes in rice. A building appetite for ethnic cuisine in this country is sparking more interest in exotic rice, such as aromatic varieties from abroad. American growers are developing new hybrids that combine high yields with these popular exotic traits.--By Jill Lee, Agricultural Research Service Information Staff.
Franklin E. Barton, Brenda G. Lyon, and William R. Windham are in the USDA-ARS Quality Assessment Research Unit, Richard B. Russell Agricultural Research Center, 950 College Station Rd., Athens, GA 30605; phone (706) 546-3288, fax (706) 546-3607.
Elaine T. Champagne and Karen L. Bett are in the USDA-ARS Food and Feed Quality Research Unit, Southern Regional Research Center, 1100 Robert E. Lee Blvd., New Orleans, LA 70179; phone (504) 286-4451, fax (504) 286-4430.
"Tailoring Rice To Suit Consumers" was published in the August 1998 issue of Agricultural Research magazine. Click here to see this issue's table of contents.