United States Department of Agriculture
AgResearch Magazine


From Cow Chips to Silicon Chips
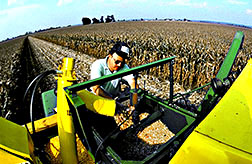
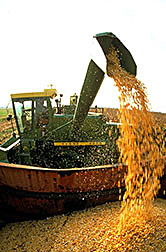 A Global Positioning System antenna (top of operator's cab) and a yield monitor allow an onboard computer to plot corn yields about every 6 feet as the combine moves along. Data stored in the computer can later be used to produce color-coded yield maps for each field. (K4912-16) |
When the little tractor on the computer screen crawled from the bluish-green region into the reddish-orange sector, Tim Badger watched the numbers in the column measuring the trail of pink vapor double immediately. As the tractor icon crossed back into the green, the score dropped off.
Badger is not a high school kid playing Ag Kombat at an arcade. As farm manager at the ARS Beltsville Agricultural Research Center (BARC) in Maryland, lie oversees more than 2,000 acres planted in soybeans, alfalfa, and corn.
What Badger was doing was test driving a computer-controlled Ag-Chem Terra Gator to apply potash at varying rates throughout a small field. The Terra Gator was adjusting application rates in response to a map of soil potassium levels generated previously by another computer.
"I was looking at a revolution," Badger says, "No guesswork, no single rate per field. To do this type of variable application by hand would have been right off the economic scale, if it could be done at all."
This is not farming in yesteryear's style. Silicon Valley has come to farming in a big way—sort of the rural lane of the information superhighway. For those farmers and ranchers who are taking the digital on-ramp, computers are changing the way almost any phase of their operation is managed.
Hardware and software are available for everything from controlling the flow of irrigation water to pinpointing application of fertilizer—from record keeping to manure management.
"Over the past few years, we've developed many ways for farmers to have larger and larger amounts of data about all aspects of fanning. Now, what the computer programs and computer-driven equipment are doing is giving farmers a way to reduce those data to manageable decision-making and then execute those decisions efficiently," explains Galen Hart, who is with the ARS Remote Sensing and Modeling Laboratory at BARC.
Hart helps facilitate ARS research in one of the holiest areas of agricultural computerization, precision farming—what Badger was trying out. Precision farming is a method that links information about growing conditions to sophisticated, computer-run farm equipment, allowing farmers to treat areas within a single field differently.
At the heart of precision agriculture is detailed information about how conditions vary across a field. Soil samples exactly located by Global Positioning System (GPS) satellites are analyzed for fertility and other characteristics. This information is then put together on computer-generated maps.
A computer screen in the cab of the tractor indicates the tractor's position in the field by the same GPS coordinates as the soil samples, so the variations in application are automatically linked to the variations in soil conditions shown on the map, usually displayed as color gradations.
"With precision farming, you get automatic customizing." Hart says. "The size of the area that can receive individualized treatment has gone from a few acres with conventional farming, to a few square feet."
But there is not necessarily a reduction in the total amount of inputs in a field from using precision farming methods.
What does happen is that the farmer can apply inputs as efficiently as possible—for example, putting the most nitrogen where the soil has the least organic material. Or realizing when the maximum possible yield on a poor spot in a field has been reached and not wasting extra nitrogen that just can't he used.
"That efficiency translates to the bottom line—getting maximum return from a field with the least possible inputs," Hart says. "For the farmer, computer support can mean making more economically sensible management decisions."
And there are environmental benefits. "When a farmer isn't wasting nitrogen, there is also less likelihood of nitrogen running off or leaching into ground water," Hart says.
Monitoring the Payoff
At the other end of precision farming is the yield monitor. With software connected to GPS, these monitors are attached to combines, where they measure weight and moisture level as a crop is harvested. Farmers get exact, accurate readings every 3 seconds for the amount harvested in a strip 2 yards long by the width of the combine. An 80-acre field of corn can generate about 77 pages of data.
That is one of the problems of computers: They can generate enough data to drown a mathematician, let alone a farmer. One way to make the data more user-friendly has been to translate the data into the same type of color-related maps.
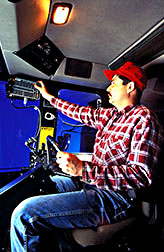 In the cab of a corn harvester, University of Maryland technician Tracy Runner checks readings on a digital yield monitor. (K7518-10) |
Some of the monitors also allow the combine operator to mark places in the data as they pass through an area. The operator chooses the categories such as wet spot, weeds, insect damage, or disease—generating even more data. But these are numbers that allow the farmer to figure out what is happening.
"The yield monitor means I can relate exactly what I see in my fields to how it affected yield in mat spot. I see the failure or success of management decisions in hard numbers," says Douglas Harford, who farms 1,500 acres of soybeans and corn near Mazon, Illinois, about 60 miles south of Chicago.
This ability of computers to precisely measure the success of decisions also puts the farmer's advisers more on the spot, Harford points out. Whether it is a paid consultant, an extension agent, or a research scientist, "I can validate their advice at the end of the season with real accuracy. I can validate everything I'm told with hard numbers," Harford says.
"For example, last fall, they said I didn't need to use an insecticide the first year I had corn rootworm, that the damage wouldn't he worth the cost of spraying. According to my yield monitor's data, where I had corn rootworm damage, it cost me 40 bushels per acre—a lot more than the cost of the spraying."
"We're really going to be able to check out how good the advice is, now."
Generating precise information on this small a scale actually turns every farm into a test farm. There is an accurate record of what went in and what yield came out, one of the requirements for scientific analysis.
Hart points out one year's data is not really enough to base major management changes on. It may lake 3 to 5 years of data to smooth out variations that are not related to management decisions, especially the influence of rainfall and weather.
"Eventually, as we spend more time looking at years of data, we may be able to develop equations and factors that will let the farmer account for that variation on fewer years of data," Hart says.
For many, the yield monitor is the access point to the computer-generated highway. It is often the first piece of computer-run equipment that farmers purchase. Others enter the computer age through accounting and recordkeeping software and a home computer.
Research by the University of Wisconsin and Meredith Publishing shows that about 250,000 of the 1.9 million farmers and ranchers in the United States have computers, says Association of Agricultural Computing Companies Vice President Warren E. Clark. He is also president of dark Consulting International, Inc., in West Dundee, Illinois, an agricultural public relations and marketing services consulting firm that has built a database of the 90,000 largest producers who own and use IBM-compatible computers in their operations.
"Of course, many others may have access to computers off the farm," Clark says. "primarily through farm recordkeeping service bureaus."
Clark adds that he believes there are three types of farmers.
"Some who have started using a yield monitor and crop mapping software and are discovering they need better financial recordkeeping, some who have been using computerized accounting and are adding yield monitors and crop mapping software, and the third type who hope they can retire before they have no choice but to deal with computers.
"It's not that different from using ATM's at the bank," Clark says.
It isn't necessary for all farmers to own enough computer equipment to do everything themselves, which makes it possible for even small farms to have access to computer aids. Cooperatives, extension offices, universities, and businesses are all providing computer services, both generating and analyzing data.
In many cases, farmers can just buy services from experts or share the cost among a group of people who need similar services.
"It's just like hiring an accountant to keep the books," Clark says. "A farmer has to keep more and more records—business accounts, records for environmental regulation, marketing information, and now soil data and yield data. You need either an expert to help you boil the data down or training to do it yourself."
Henry Hagenbuch, who farms soybeans and corn with his brother in north-central Illinois, figures that he will offset the costs of precision farming, including buying a yield monitor, in 2 to 4 years.
"We've only looked at the numbers crudely, but that's how it comes out. With 1,100 acres, a small improvement per acre can pay off quickly," Hagenbuch says.
He began keeping accounting records for his farm on a computer in 1983, and today he looks at marketing data by computer at least weekly. Hagenbuch purchased a yield monitor 2 years ago and so far has had about half of his soil tested as part of precision farming.
"I was amazed to find pH's [soil acidity] below 6 and above 7 in the same field. It certainly changed the way I have lime put down," he says.
However farmers get their mountain of information, it has turned their winters into a season of planning rather than rest. With exact yield data in hand, farmers go back and figure out why harvests were lower in some spots than in others.
Automating Irrigation
One of the biggest advantages that computers can provide is information on what is actually happening to crops right this minute—not what the farmer thinks might be happening, or what it looks like might be happening.
For example, within a few years, a cotton farmer in Lubbock, Texas, might finish lunch and then run a quick check for a flashing red light on the office computer console.
"I know it's been hot for the past few days; the plants are thirsty now," the farmer mutters and reaches for a glass of iced tea, content that the computer has turned the irrigation pumps on.
Had that cotton farmer driven out to the fields in the hot afternoon, the same red lights would have been flashing on a center-pivot irrigation pipe as it watered crops in a giant circle. What the farmer would not have seen is the infrared signal that the plants were sending to flashlight-sized thermometers mounted on the irrigation arm.
The invisible infrared signal is used to take the temperature of cotton leaves every 6 seconds around the clock. The warning lights came on because the cotton showed a temperature of more than 82° F for more than 4-½ hours—a combination that spells a need for water.
With this computer-controlled equipment, irrigation lakes place only when there is hard evidence of the plants' need for water.
The system is based on a concept discovered by ARS scientist Dan Upchurch and colleagues Don Wanjura, John Burke, and James Mahan at the USDA-ARS Plant Stress and Water Conservation Research Unit in Lubbock.
Plants need water both for growth and to remain cool. Each crop has a preferred temperature range at which it grows best, called the thermal kinetic window.
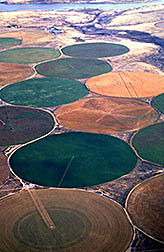 Over 100 center-pivot sprinklers controlled by a central computer irrigate wheat, alfalfa, potatoes, and melons along the Columbia River near Hermiston, Oregon. (K4904-20) |
There is also, for every location, a certain amount of time that the weather causes even a well-watered plant to be above its optimum temperature. This is called a site-specific time threshold.
As the system is envisioned, farmers would control their automated irrigation systems with a computer cartridge containing both the thermal kinetic window and time threshold for each crop. Prototypes have already been built, and the scientists have recently signed a cooperative research and development agreement, in hopes of bringing a farm-size version to market.
Upchurch says they and researchers from other ARS locations have finished testing prototypes on experiment station fields in Lubbock and Bushland, Texas, as well as in California and Mississippi.
Based on the tests, Upchurch says the system should pay for itself in water savings, since it waters only when the plants need it and tends to use less water than conventional full irrigation systems.
Computers for Livestock
One of the unique abilities of computers is to enable farmers and ranchers to play "what if?" With a computer's capabilities, they can try out different management scenarios and have the computer project through a whole season, to predict profit and loss outcomes.
Cattle ranchers, for example, might use a program like STEERISK, which was developed by ARS rangeland scientist Richard Hart at the High Plains Grasslands Research Station near Cheyenne, Wyoming. This program helps ranchers estimate their potential profit or loss from yearling stocker cattle at many possible combinations of forage production, stocking rates, and buying and selling prices.
Forage production, a key component in the computer program and in ranch management, can be estimated. Ranchers in the Central High Plains can do this easily: Forage production is largely determined by precipitation in March, April, and May. Cattle don't normally go onto ranges until May in this area, so producers pretty well know how much forage their livestock will have.
Forage production and prices determine stocking rates for the season. Hart says even if ranchers over- or under-estimate forage by one-third, they will reduce net returns only 11 to 13 percent.
STEERISK can also help ranchers decide whether insect pest control should be initiated.
Hart used his model to demonstrate that reducing the stocking rate could be more profitable than grasshopper control, even when grasshoppers ate up to half the forage. STEERISK showed that hoppers would reduce returns by $19.85 per acre, from $21.79 to only $1.94, if the stocking rate were not changed. But if the rancher decreased the stocking rate to make up for decreased forage, returns would be reduced by only $9.97 per acre.
"Thus, unless grasshoppers could be controlled for less than about $10 per acre, it would be wiser to just put fewer livestock on the range," says Hart. "Similar calculations could be applied to weed and brush control."
STEERISK can also help ranchers evaluate and select their best marketing strategies, if they anticipate a higher market price, they might look at keeping the livestock on the range longer. However, weight gains begin to decrease as the grazing season advances, and cattle gains may drop below the level needed to pay carrying costs if the rancher waits too long. The program can calculate if the anticipated price increase would compensate for the reduction in gain.
Originally designed for use on the High Plains area in southeastern Wyoming, southwestern Nebraska, and northeastern Colorado, STEERISK could he modified for use in other areas. Estimates of forage production in good, average, or poor years can usually be found in Natural Resources Conservation Service soil surveys.
Hart has distributed more than 100 copies of STEERISK and conducted a short course to demonstrate its many uses. He wrote it for use in Lotus Symphony Release 2.0. Other spreadsheet programs can be used, but some changes may be needed.
 Net Merit, a computer program developed by ARS geneticist Paul VanRaden, ranks dairy cows based on the economic value of their genetic traits—such as milk quality, productive lifespan, and resistance to mastitis, a common dairy cow disease. (K7168-6) |
Computing in the Dairy Industry
Dairy producers have done more with computers than nearly any other group in agriculture—using them for feeding regimens, manure management, calculating milk yields, keeping track of medications and antibiotic residues, and breeding records.
Since the 1930's, scientists in the ARS Animal Improvement Programs Laboratory in Beltsville, Maryland, have received data on dairy cows and distributed genetic evaluations of dairy hulls.
"American cows gain 30 gallons more milk production capability each year because of selective breeding," says animal geneticist Duane Norman. "Nationally, we produce more milk with fewer cows every year, thanks to this program."
The lab evaluates 140,000 bulls for several traits based on records of 20 million of their daughters.
To help producers make sense of so much data, ARS geneticist Paul VanRaden developed "Net Merit"—a scale that ranks dairy animals according to the economic value of their genetic traits—such as milk quality, productive lifespan, and resistance to mastitis, a common dairy cow disease.
"With Net Merit, farmers get a simple number that combines all available yield and fitness data necessary to estimate the animal's worth." says VanRaden.
The Dairy Herd Improvement Association, a cooperative of dairy producers, collects and sends the nationwide data on dairy cattle to seven regional centers to be compiled. After ARS scientists receive it, they run genetic evaluations and produce the Net Merit rankings based on those evaluations.
The lab has also developed procedures to compare genetic evaluations for Canadian and European bulls on the same basis as American bulls. This expands cattle breeding opportunities for farmers here and abroad.
Locating breeding bulls is also becoming easier, thanks to computers. There are at least 12 kinds of software now on the market for finding the right bull based on genetic rankings and semen price. Most programs use ARS’ genetic evaluations, and many include Net Merit rankings.
Bill Hageman, genetics specialist with Sire Power, an artificial insemination firm in Tunkhannock, Pennsylvania, calls the ARS service his company's life-link to clients. He explains that gelling data on bulls from an independent source gives his company credibility.
"It's like buying a car. You look through the consumer reports for unbiased information on what you're buying," he says.
According to Norman, genetic progress from early estimates was very limited. "We used to do mother-to-daughter comparisons that were rather simplistic," he says. "Now we evaluate for a host of trails with much more precision.
"It's fortunate that our dairy industry never gave up the effort to improve, especially in light of what we have now. With computers, we're solving millions of equations simultaneously, to predict the genetics for several traits that a cow needs to be profitable."
The Next Frontiers
The extent of precise data that can be computer-generated will also drive some research directions.
"Farmers are going to want more information about what particular changes will do. They'll wonder, if they can measure it, what is going to happen if they adjust it," says BARC's Galen Hart.
Programs will have to be developed for more types of crops. Yield monitor programs have been developed for only a few crops so far, like soybeans and corn.
Operating the computers and understanding the data will also have to be made more user-friendly—that is, computer commands made easy to understand, printouts easy to follow. Most people are turned off by having to wade through a lot of technical jargon or large stacks of numbers.
"To produce really usable software, we need better research and engineering processes that include the needs of stakeholders like farmers directly," says soil scientist Sam Alessi, who is in the ARS Soil Management Research Unit at Morris, Minnesota.
"Including farmers' real needs is crucial, but it's only a small part of the organized management needed to produce quality software," he says. "Design of software architecture and management of changes are areas in desperate need of improvement."
A start is for the researchers to first write and publish statements of need, along with input and reaction from the potential users, Alessi explains. "Communication and a sense of partnership between equipment developers and users will give us better products."
Alessi is already putting that concept to work. Working farmers were an integral part of creating the design of the software FarmBook right from concept development.
FarmBook is a farm-scale system for keeping precise records, all the way down to vehicles and fuel use. Farmers provided feedback on what other records they need to have managed and what type of formats would be more useful.
One result of that involvement was that local farmers were enthusiastic about the potential computer system. A group of them formed SunRise Software, Inc., which signed a cooperative research and development agreement with ARS to develop a more complex, commercial offshoot of FarmBook called FarmWin. FarmWin is a Microsoft Windows-based farm records system that includes integrated inventory, production records, rudimentary mapping, and basic financial management. It manages records of farm operations including crops, planting, tillage, yields, expenses, and income.
Future plans include addition of various decision-aid modules that incorporate ARS research findings, helping farmers compare agronomic, environmental, and economic tradeoffs.
Like many industries in their early years, computer services are proliferating along many paths at once. One of the directions that is needed for the future is standardization. It would be easier for farmers if programs used common word cues and could take data from each other directly. Being able to talk to each other is always a major improvement.
— By J. Kim Kaplan, ARS; Dennis Senft, Don Comis, and Jill Lee, ARS, contributed to this story.
Watering for Peanuts
ARS field technician Tommy Bennett was sitting in front of a computer terminal scratching his head, having doubts. He was testing new software, and the program said to water the field of peanuts. Bennett didn’t agree.
But this was a test of the program, so Bennett followed the computer program's decision, not expecting much. Two days later, what he saw in the field made him a believer.
"I didn’t think we needed to irrigate. But after a couple of days, the control plots started wilting and the test plots were still looking good," Bennett says.
EXNUT, as the program is called, is based on 10 years of peanut farming data collected by mechanical engineer Jim Davidson and other ARS scientists at the National Peanut Research Laboratory in Dawson, Georgia. "We found there was a connection between soil temperature and peanut yield and quality," Davidson says.
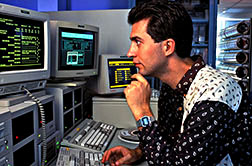
 In Missouri, agricultural engineer Kenneth Sudduth examines corn from this combine's grain flow sensor. The combine is linked to the satellite-based GPS, allowing precise yield and location data to be correlated with soil samples taken earlier throughout the field. This information will help growers plan best fertilizer rates for the next crop. (K4911-6) |
County extension agent Harold Wilson, of Terrell County, Georgia, convinced six farmers in his area to give EXNUT a try. Wilson asked Davidson for a copy and installed it at his extension office.
Then he hired a technician to visit the six farms, take biweekly soil temperatures, and feed them into the program. Then, if it was time to water, the technician called the farmers. The results of the 3-year trial surprised Wilson, who has been an agent for 22 years.
"I questioned EXNUT until it started beating me in predicting when to water," he says.
Dawson farmer J.W. Law of F & L Farm, who participated in the first 2 years of the test but not the third is determined to use it in the future. "I tested it for 2 years but skipped it this year," says Law. "I wish I hadn't, because I surely needed it."
Bennett says the program is easy to use. The software integrates several factors, including soil temperature, water records, soil type, peanut plant stage and variety, and probability of rain. To use it, a grower finds the day's maximum and minimum soil temperature with a soil thermometer. That information and other data are entered, and the computer calculates the advantage of irrigation or fungicide use.
Davidson started working on the EXNUT program when university extension agents complained that farmers failed to water on time for lack of reliable information, "Since about 1985, the main things we've done is refine the logic and add user friendliness."
Davidson says that a good feature of his program is it explains how it arrived at a watering decision, so a grower can consider the computer's reasoning against his or her own.
"Right now, it's being used to some degree in every major peanut farming state," he says. "It's a good partner for any peanut farmer."—By Jill Lee, ARS.
Computing Pollution
Whenever homeowners or farmers apply nitrogen fertilizer to lawns and fields, they risk nitrates ending up in drinking water supplies. If irrigation water or rain flushes nitrogen past the reach of sod or crop roots, it's a waste of expensive fertilizer and may become a threat to the environment.
ARS has developed a computer program called NLEAP (Nitrate Leaching and Economic Analysis Package) to help determine if there might he a nitrate leaching problem.
"Farmers can use NLEAP to decide if they should change management practices such as the timing and amount of nitrogen they apply, their method of tillage, irrigation, crop rotations, and whether to use livestock manure for crop nutrients," says Marvin J. Shatter, an ARS soil scientist in Fort Collins, Colorado.
In Colorado's San Luis Valley, NLEAP is helping farmers more accurately estimate both how much nitrogen to apply to meet the needs of crops such as potatoes, small grains, lettuce, spinach, carrots, and rapeseed and how much remains in the soil. This helps keep excess nitrogen from reaching groundwater and can potentially save farmers money.
Because farmers have wanted to ensure high yields of high-value crops such as lettuce, they have tended to apply far more nitrogen than actually needed. In extreme cases, growers were putting on 1,000 pounds of nitrogen per acre, when they actually needed only 90.
The central Wisconsin sand plain of Portage County is very sensitive to groundwater problems because the region has a shallow water table—often within 10 to 20 feet of the soil surface—and because it has light, sandy soils that promote nitrate leaching. About 25 percent of rural water wells in the area exceed drinking water standards for nitrate. NLEAP demonstrated that growers in that area can reduce nitrogen application rates by 20 to 45 pounds per acre and thus lower nitrate leaching by 3 to 41 pounds per acre.
"We found NLEAP was doing a pretty good job estimating the amount of nitrates that were actually leaching underground," says James D. Kaap, water quality specialist with USDA's Natural Resources Conservation Service in Janesville, Wisconsin. He says the agency is now using the program in another trouble-prone area in eastern Wisconsin.
NLEAP has been distributed to farmers, agribusinesses, and state and federal agencies in North America and Europe. The scientists have encouraged users to make copies and pass the program on to others.— By Dennis Senft, ARS.
"From Cow Chips to Silicon Chips" was published in the April 1996 issue of Agricultural Research magazine.