ARS Home » Plains Area » Las Cruces, New Mexico » Range Management Research » Docs » Long-Term Data

Use Our Data

Our data and datasets are organized within "catalogs". These catalogs represent collections of certain types of data associated with either our research program (Jornada) or data sets collected from dozens of research locations around the country (EcoTrends).

The Jornada Data Catalog is searchable for a number of different attributes including keywords, data category, and status.  These data sets are dynamically updated as we collect new data associated with ongoing studies.

To access data and datasets:
Download - Within any catalog you will find a [Download Data] link that will allow you to use the data in a desktop application such as Excel or Access. Each dataset includes associated files that describe important features of the included data such as the time period of collection, the manner in which data were collected, and specifics of location of collection.

Assistance - If you need assistance with data access or guidance on data analyses, you may contact Darren James at dkj2@jornada.nmsu.edu with specific questions or requests.


With long term data, we can see the vegetation change over time (1915 - 2011) on the Jornada. This video does a nice job of illustrating shrub invasion on a small scale.
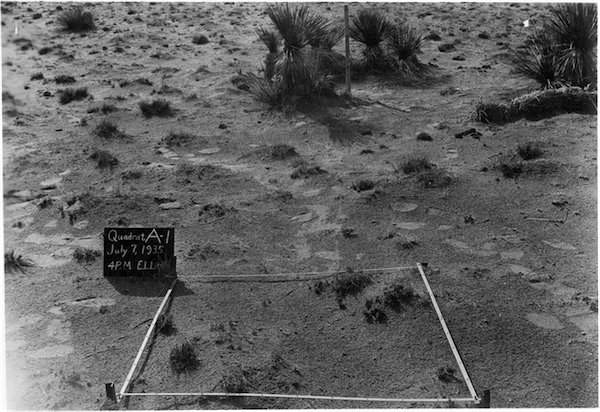
  Quadrat A1, July 1935
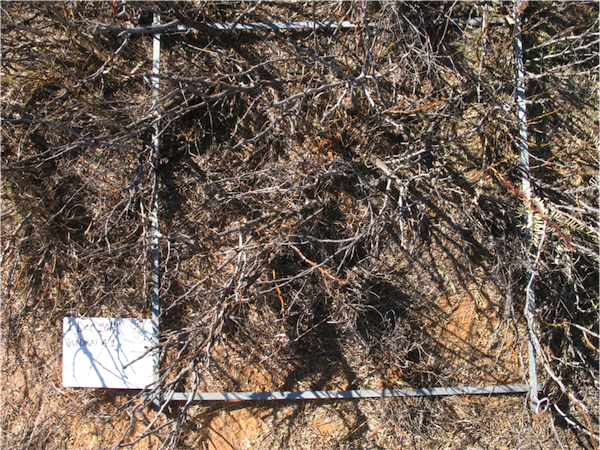
  Quadrat A1, December 2011
   West well precipitation near quadrat A1 TD>

The interactive graph above shows monthly precipitation (inches) at JER headquarters for each month in 1915. The precipitation is depicted as bubbles whose size is proportional to the average maximum monthly temperature. Clicking the Play arrow in the lower left-hand corner will start an animation of the data record through 2013. You can label each bubble by clicking it or by using the select tool in the lower right-hand corner.

These monthly averages were calculated from daily maximum temperature and precipitation values. Along with minimum temperature, these data have been collected at Jornada headquarters since June 4, 1914. It is available through the NOAA Satellite and Information Service at http://www.ncdc.noaa.gov.


The monsoon season, the period during the summer when thunderstorms provide a little more than 50% of our annual precipitation, is defined by the National Weather Service as June 15 - September 30. The graph above was developed from a 35-year record of daily rainfall within the northern portion of Dona Ana County, New Mexico, about 25 miles northeast of Las Cruces, NM. The graph presents the date each year we have estimated to best represent the start of the monsoon season. Typically, the monsoon season most often starts the first week of July, but it has started as early as June 15 and as late as August 6, since 1976.

Share this